Stock Trading Signals Platform
Intelligent investment assistant that performs technical analysis for a number of stocks, automatically tracks multiple indicators on stock exchanges, and generates buy/sell and risk signals for human traders.


About the Client
The client is an investment company that specializes in active day trading in the stock market. It employs traders who actively trade stocks, currencies, commodities, derivatives, and other assets using a number of proprietary trading strategies.
Project Background
The client needed a configurable platform that could automate technical analysis tasks and calculations according to the company’s strategies for different asset classes. This would allow the in-house trading team to identify investment opportunities more quickly and make decisions with fewer mistakes, thereby increasing the company’s trading profits.
Project Team


Engagement Model
Fixed price for the MVP stage, Agile/Scrum for other stages
Tech stack


Architecture Overview
The platform analyzes a large number of assets traded on an exchange (mainly stocks and ETFs); it accumulates trading data such as open-high-low-close (OHLC) prices, price changes for different time periods, trading volumes, orders, etc. It calculates a set of technical analysis indicators per configured strategy and displays the results of the analysis as buy/sell signals when specific market conditions are met.
Platform features:
- Collects all trading information in real-time for more than 5000 stocks
- Receives information from more than 20 stock exchanges
- Calculates the following technical analysis indicators: • Exponential Moving Average (EMA) • Simple Moving Average (SMA) • Average True Range (ATR) • Fisher transformation (FISH) • Rate of Change (ROC) • Moving Average Convergence/Divergence (MACD) • Know Sure Thing (KST) • Ichimoku Cloud (Clouds) • Commodity Channel Index (CCI, CCI Cycle, CCI Top Dip, CCI Cycle End) • Schaff Trend Cycle (STC)
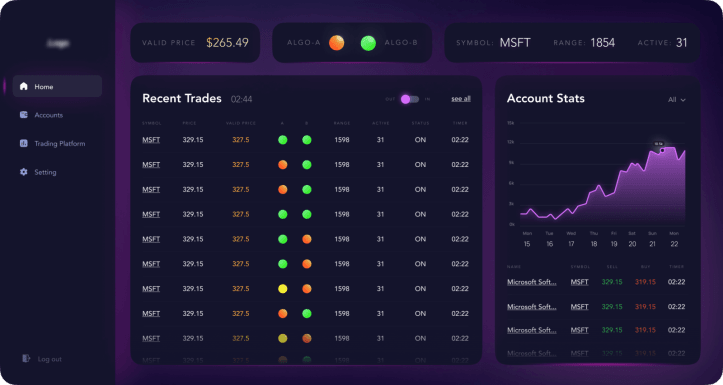
Trader Panel UI represents a floating window with real-time data that a trader can see at the top of their trading station application.
The results of all calculations and analyses are represented by color codes — called main lights and backlights — for each position. Main lights – RED, YELLOW, GREEN – indicate whether the current price is good or bad for buying or selling this stock. Backlights – BLUE, GRAY, WHITE – depend on momentum technical indicators and show the strength or weakness of the prices of a stock. The different backlights communicate to traders whether stock prices are significantly rising or falling. The different combinations of main lights and backlights provide traders with an in-the-moment picture of what is happening with a given stock. The system’s administration module allows administrators to change configuration settings, adjust strategy parameters, and manage settings and the list of stocks shown in the Trader Panels. It also displays trading information in different views.
The main technical challenge of the system was to achieve high performance and low latency. The system must process data, perform calculations, identify investment opportunities, and display trading signals within milliseconds after the market event happens.
Development Process (or Project Approach)
We used the Scrum framework to implement this project. Each iteration lasted three weeks, the first two of which were spent implementing the requirements from the iteration backlog, and the third week testing and debugging. At the end of each three-week sprint, we held a demo session to demonstrate the functionality increment to the client. Any resulting notes or update requests were forwarded to us and were implemented simultaneously with the following sprint.
Third-party integrations
The solution is integrated with data vendor Finage to receive real-time stock market data via the WebSocket mechanism.
Technical solution highlights
The client part of the solution was implemented as a resizable Windows desktop application using the Blazor solution. The resizing feature was very important, as traders usually have many programs open on their desktops and space availability is a critical issue. Blazor was chosen because it is one of the best technologies for web developers on the .NET stack, allowing client/server-side web and desktop & mobile applications to be developed entirely in C#. Using the same technology to develop the web and desktop parts also allowed us to reduce the cost of the product. Multiple instances of the client application can be run on the same PC. This allows users to run as many instances as needed to track information about the most traded stocks during the current market session. The architecture of the system is defined by very high performance requirements. Trading opportunities can appear and disappear in a fraction of a second. Therefore, the system must process massive volumes of data simultaneously to respond to market events in real time. Here you can see the diagram of the backend architecture:
1. Technology stack and components
Microsoft .NET, C#, Microsoft Azure, and SQL Server were selected as a mature, well-supported, enterprise-grade technology stack. React.js, SignalR, and Blazor were chosen to implement the system’s rich, real-time interfaces.
2. Horizontal scalability
The system can be easily scaled by adding additional server instances.
3. Low latency data processing
To ensure quasi-real-time performance, the system uses parallel calculations in multiple threads with asynchronous queues, for event processing to fully utilize multi-core, multiprocessor server instances.
Project Challenges
We needed to select a data vendor that would fit the solution, with respect to both the technical (e.g., WebSocket, real-time data, latency) and business (any stock trades) requirements. There are multiple data providers on the market and they can be divided into two groups:
- The first group is made up of official vendors (~70) of real-time stock market data. These vendors must comply with exchange regulations; as such, supporting their products and using their services requires you to sign an additional agreement with CTA (Consolidated Tape Association) or UTP (Unlisted Trading Privileges) companies. Consequently, these tend to be very expensive, costing up to $10,000 per month.
- The second group comprises third-party providers that can offer almost the same services as the official providers for a lower price, with the tradeoff of some additional limitations in data format and connectivity.
Our team conducted research and made comparisons between the available market data providers, examining factors including data quality, fees, latency, and connectivity options. The results from our analysis and our recommendation were shared with the client for final decision making. As a result, Finage was chosen as the data provider that best matched the client’s needs, due to the following factors:
- delivery of real-time market data via a WebSocket protocol
- availability of historical data
- acceptable latency
- reasonable fees
In order to correctly determine all technical/economic indicators and trading signals, it is key to be able to accurately calculate OHLC prices for 24 secs/1 min/4 mins/5 mins time period bars. If one were to implement OHLC calculations on raw data using only mathematical formulas, and then cross-check their values with Yahoo Finance, they would see a significant difference. The problem is, some data providers (including Finage) will sometimes supply raw data that must be pre-processed in a specific way before OHLC calculations can be performed. Raw data must be adjusted to account for factors such as sales conditions and volume. For this project, pre-processing was performed in full accordance with Consolidated Tape Association (CTA) and Unlisted Trading Privileges (UTP) specifications to ensure the accuracy of calculations.
One of the client’s main requirements was that the solution should have very low latency so that traders could see changes in indicators reflected within milliseconds following the occurrence of a related market event. To achieve this, our team developed a multi-layered architecture with advanced caching and multi-threaded calculations, in order to fully utilize multi-core and multi-processor server instances. We split indicators and signal calculations between the backend and frontend components. Performing some of the calculations on the client side allowed us to significantly reduce the server load and increase performance.
Results
The first version of the platform was delivered in full compliance with the specifications, on time, and on budget. Within 6 months of the project’s start, the system was live and available to real end-users trading real stocks. The system allowed for significant reductions in the amount of time traders spent on technical analyses and the number of mistakes, in addition to increasing profits from the trading operations. The project is still underway, and the Itexus team continues to provide support and maintenance services.
Need to develop a similar stock trading platform?
A mobile banking app that allows its users to access all banking services in a secure, convenient and fast way without having to visit bank branches.


